Examples: query, "exact match", wildcard*, wild?ard, wild*rd
Fuzzy search: cake~ (finds cakes, bake)
Term boost: "red velvet"^4, chocolate^2
Field grouping: tags:(+work -"fun-stuff")
Escaping: Escape characters +-&|!(){}[]^"~*?:\ with \, e.g. \+
Range search: properties.timestamp:[1587729413488 TO *] (inclusive), properties.title:{A TO Z}(excluding A and Z)
Combinations: chocolate AND vanilla, chocolate OR vanilla, (chocolate OR vanilla) NOT "vanilla pudding"
Field search: properties.title:"The Title" AND text
Answered
Hello, We Have Noticed That Debug Images Takes Way Too Long To Load 6 To 8 Seconds When Requesting Events.Debug_Images We Also Notice That The Returned Object Is Quite Heavy, About 2-3 Mb, I Think It Contains A Lot Of Unnecessary Info We Also Have 20 Mill

Hello, we have noticed that debug images takes way too long to load
6 to 8 seconds when requesting events.debug_images
We also notice that the returned object is quite heavy, about 2-3 MB, i think it contains a lot of unnecessary info
We also have 20 million image entries into elasticsearch index (you guys dont have rolling indexes which has also caused a lot of problems before)
What could we do to improve the loading time? We just upgraded fro, 1.17.0 to 2.1.0 but no improvement is seen
image
image


Posted one month ago
Votes Newest

Answers 7


@<1855782479961526272:profile|CleanBee5> , I'm guessing that the files server (debug samples are saved there by default) is experiancing load due to the amount of debug samples.

Regarding the size, ClearML SDK only logs/uploads whatever you create, so if you want less load, you can also use smaller/lighter images.


Posted one month ago

Not a solution, but just curious: why would you need that many "debug" images ?
Those are images automatically generated by your training code that ClearML automatically upload them. May be disable auto upload image during Task Init ?


Posted one month ago

its not millions of images per task
Its around 10k to 100k
But ok, i understand its not possible to do optimize this currently then


Posted one month ago

@<1855782479961526272:profile|CleanBee5> , in that case you should beef up the resources running the apiserver.

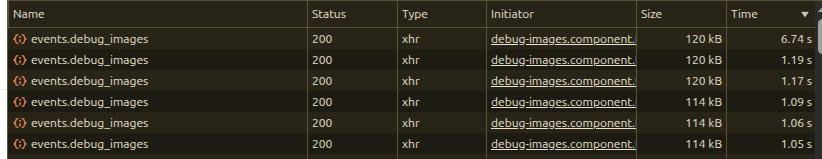
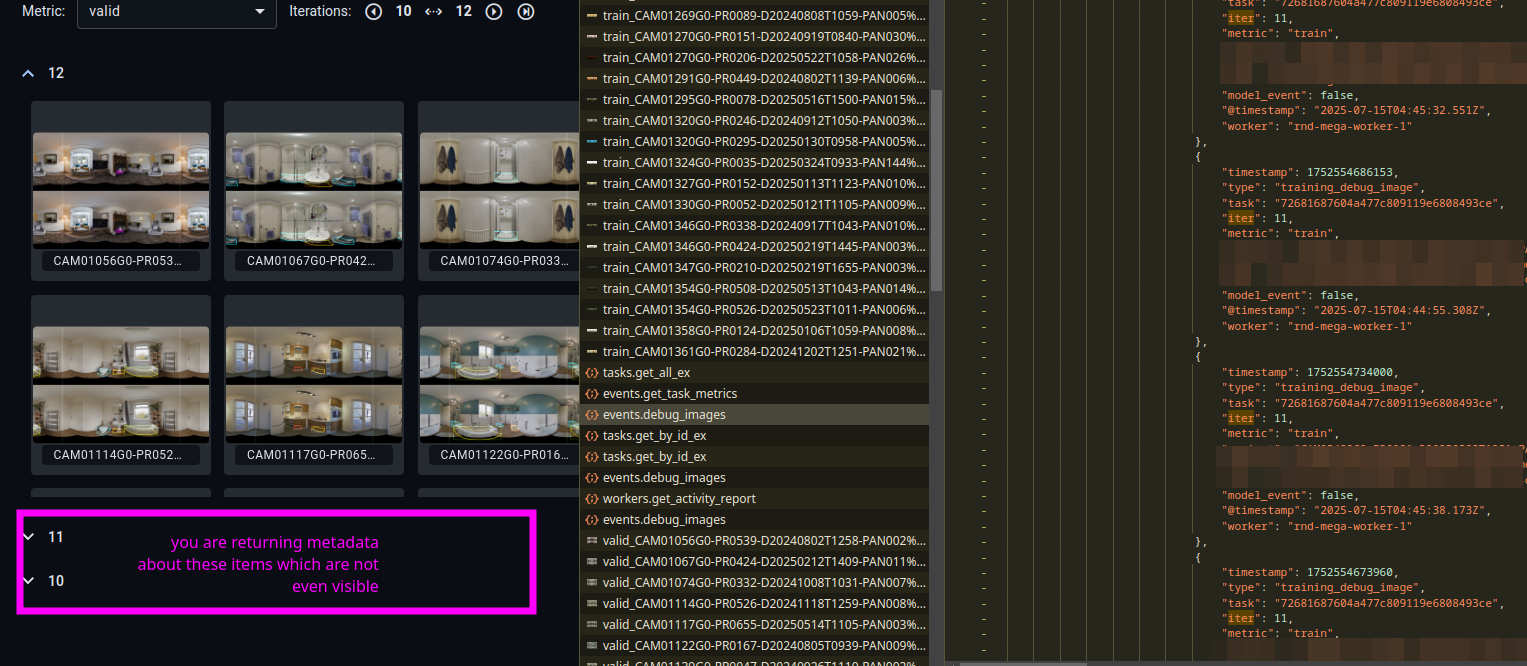
In the end of the day, this 2-3mb payload basically contains all the events (including debug samples metadata + links) of thousands of iterations. You could modify FE code to load a smaller range of iterations or remove some metadata (the metadata should be minimal, such as iteration and name of the metric)

Additionally, I believe the enterprise version supports rolling indexes.


Posted one month ago

then dont use clearml to look at images

I don't think ClearML is design to vizualize millions of image per task. At least not the Debug samples section. That was design so that you can see for a given set of image, how does the model perform epoch after epoch.

For vizu millions of image, you have tool like Fiftyone.


Posted one month ago

We are not using fileserver to store the images
We are using S3, the image loading itself is fast, aroung 100ms
What is slow is the request to server which creates a gigantic json that is sent back.
Saying to use lower res and smaller amount of images is like saying "then dont use clearml to look at images"


Posted one month ago

Because we need a lot of debug images
We have experiments where assessing quality requires us to look at a lot of images


Posted one month ago
244 Views
7 Answers
one month ago
one month ago
Tags